Assessing Players, Teams and projecting the upcoming 2021/22 season
An introduction to Win Shares and to our projection model

Part of our daily coverage of the upcoming season of the National League will be about projecting games, talk about a roster’s strengths and weaknesses, debate of what a player is worth this season or the next, etc. While everyone can weigh on those questions with his own personal knowledge of the league, or dig deeply into micro-stats to prove a point, there is a simpler way to do it. One way that will also fit into a 1000 words article or a few tweets...
Assessing players and teams in a heartbeat has always been a dream for all analysts. From baseball to many other sports today, the use of a one, all-around, go-to stat is now a reality for teams, media and the public. You have probably heard of WAR (Wins above replacement) or GAR (Goals above replacement), used in the NHL but those require data who do not always have for the National League, or for which we do not trust the source.
Introducing Win Shares
Win Shares are a statistic created by the famous baseball analyst Bill James, who wanted to quantify how many wins a player had brought to his team over a season. His model was adapted to hockey1, thanks to Justin Kubatko.
The actual formula is as long as a Canadian tax form but is based on a simple principle: assessing separately offensive and defensive contributions. In both cases, the player’s performance (goals and assists offensively, 5v5 goals differential defensively) is always computed relative to his team overall performance, his position on the ice and his time on ice. A good player on a good team will not really benefit from his easy surroundings when a good player on a bad team has some sort of excuses.
Using a unique stat to describe a player can be debated and we agree on that! Our position is that using Win Shares gives a quick overview of what a player is worth. However, the reasons why a player is good or bad can vary greatly. Analyzing his impact on defense, offense, transition, play building, special units and such require much more precise stats and video analysis. And believe us, we will use all of those this season ! But in the meantime, Win Shares allow us to do many cool things.
Assessing a player ahead of the season
From game 1 to 52, each player would see his Win Shares evolve according to his performances, but that means a lot of volatility for a good portion of the season. The work done by the writer from The Athletic Dom Luszczyszyn inspired us to model a logical way to obtain a stable Win Shares value for each player, even before the season starts.
The solution was simple, we needed to take into account the performance on multiple seasons.
For the players coming from another league, we decided to translate their performance in that league (let’s say the KHL) into a National League equivalent, using our points projection model. We can see below that, historically, the more a player scores, the higher his Win Shares. The same process is also used for goalies, using Save %.

Following the same methodology as for our points projection model, it appeared that the most predictive was to weigh the previous season (2020-21) at 75% and the one before (2019-20) at 25%. By chatting with Dom Luszczyszyn, we also understood how to make those weights shift gradually as the season moves on to more and more bend towards 2021-22.
Basically, if on day one a player’s performance for 2021-22 accounts for 0% of his Win Shares value, a year later it would account for about 50%, with 35% for 2020-21 and only 15% for 2019-20. Hence, a player’s Win Shares value will change every game as the season goes on, which is only fair and just, especially when they have an amazing or underwhelming season...
Projection for the upcoming season
To introduce you to every player in the league and give you an overview of the roster’s strengths, we will use the following ID Cards, showing the basic information we need and more...

Those cards show the performance over the last few seasons, in points and Win Shares, both translated if needed for the National League. We can see our projections for points and Win Shares for the season and where the player ranks in the league given his Win Shares value. David Desharnais is here at the 79th percentile among forwards with his 1.7 Win Shares.
Finally, on the right, we offer a resume of the data we collected ourselves the past two seasons but this will be the subject of another presentation on all the stats we will use to analyse the league!
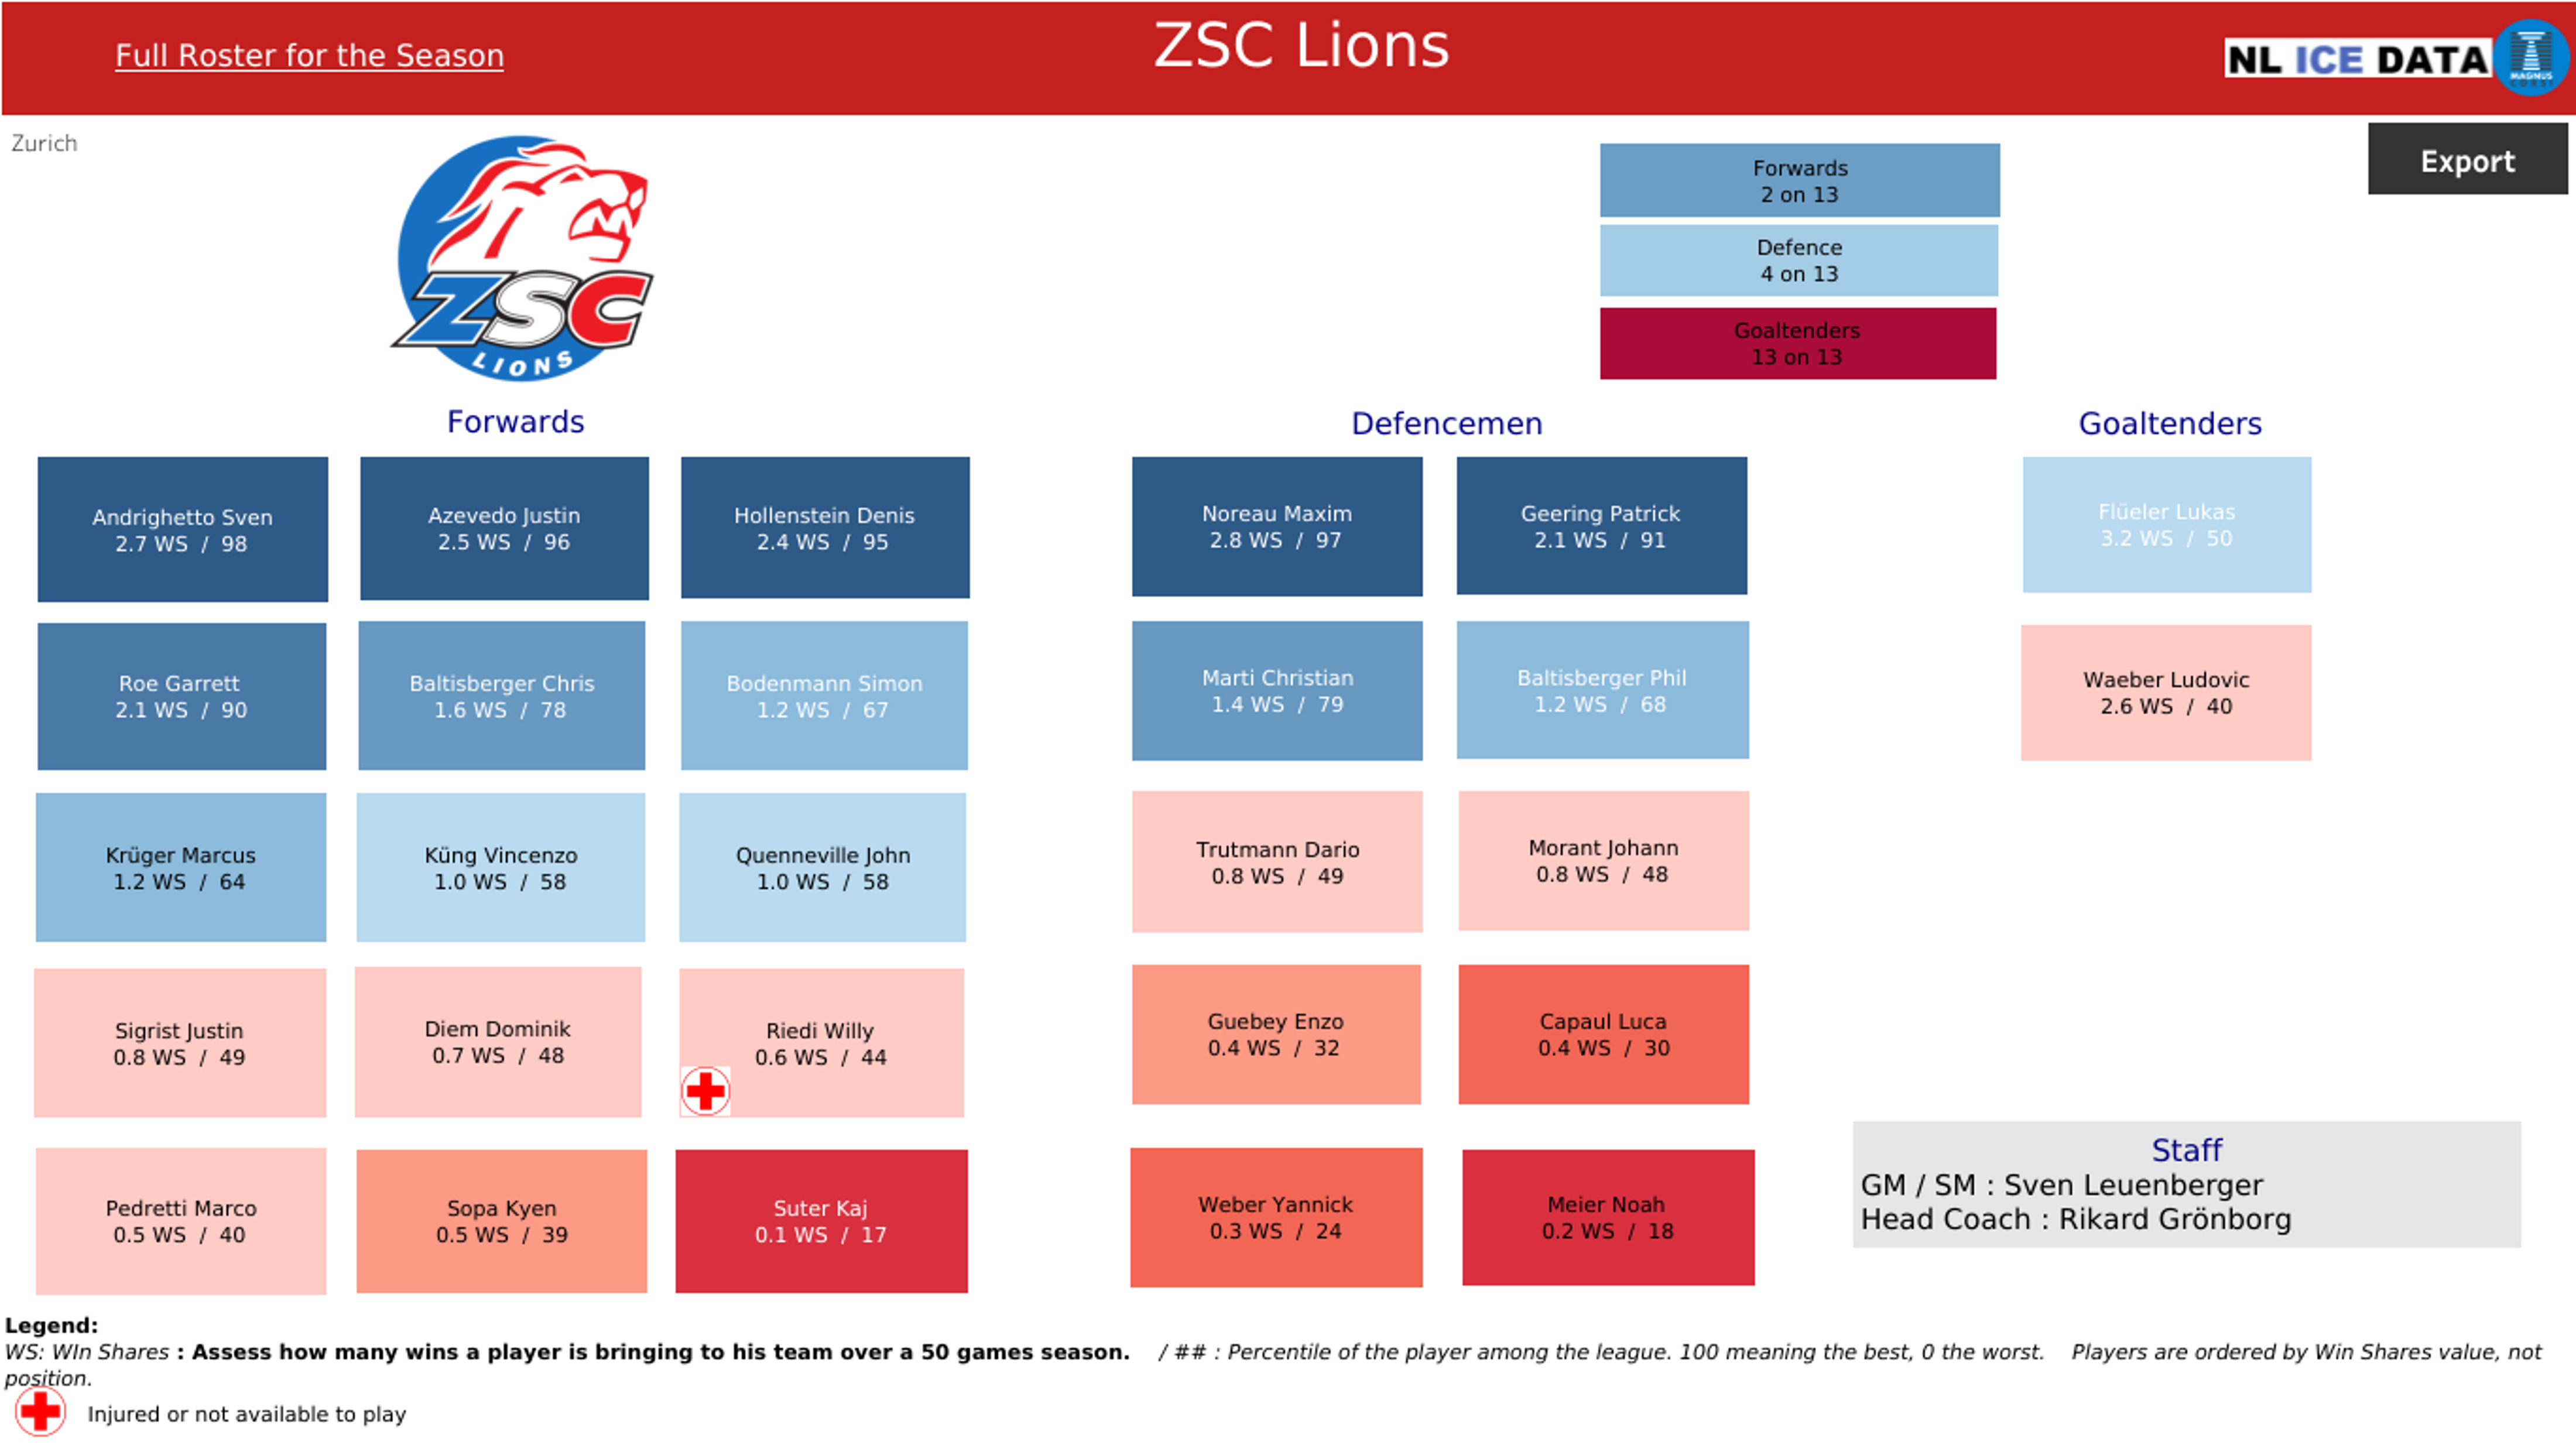
What about teams? The next step was to put together the rosters and see their total value in Win Shares. Zürich has four forwards ranking over the 90th percentile (Andrighetto with 2.7 Win Shares is at 98, Azevedo at 96, Hollenstein 95 and Roe 90). At the blue line, Noreau is worth 2.8 Win Shares and Geering 2.1, also both in the top-10 of the league. And even if the model is not keen on the goalies or on Yannick Weber for not having played at all last season and putting 3 points in 41 games the year before, that roster is projected to finish…high in the league (no spoilers).
Game Probabilities and Projected Standings
How do we know that? By simulating all the games that will be played this season, each time using the Win Shares total value of the teams and a home ice adjustment.
For now we can only do it by thinking the teams will ice their top-20 men every game, and the back-up goalie here and there. But on game day, we will be able to give actual probabilities using the real rosters and starting goalies.

If on that opening day, Ajoie is combining 0.34 Win Shares per game in its roster, and Biel-Bienne 0.55, even with the boost of home teams historically winning 56% of their games, Ajoie will still be the underdog with just 40.6% chances of winning.
The model was used in France, where it gave from 66% to 70% of correct projections over the last three seasons. And we tested it last year in Switzerland, for 63% of correct picks.
And so, as the season moves on, we will continue to add actual points earned on the ice to the projection of the remaining games left. Taking into account if some players have sustained long term injuries, if a new import signed and, as we explained, the evolving Win Shares value of each player at the roots of the model.
And yes, we will even have an ongoing projection of the Playoffs… But we don’t want to spoil the teams previews yet.
Let the fun begins!
You can also follow us on our Twitter pages here and here or subscribe to our newsletter below if you don’t want to miss our coming articles.
You can also find some more statistics on NL Ice Data here: nlicedata.com
https://www.hockey-reference.com/about/point_shares.html