

NL Ice (outils) Hockey Manager (Tools)
TIME TO PLAY !

Le descriptif des outils est aussi en français plus bas dans l’article.
I (Thibaud) will say that, personally, I have always found the Hockey Manager game fascinating. On this side of the Atlantic Ocean (I’m in Montreal if you didn’t know), we are used to hockey pools but they are quite boring, really. It is just goals, assists, maybe penalties, but you don’t have to define lines and defensive pairs, there’s no daily strategy of defining a captain, no evolution of how much costs a player, etc.
To sum it up, IT IS GREAT !!!
That is why we were very excited to work on developing a few tools for the HM players out there. I admit this was done quite at the last minute and it is VERY possible that some more tools, stats and visuals will be added later in the season. But so far, here is what we built for our subscribers.
ENGLISH
We built two pages so far, with a different use for each. Some information are on one page and the rest on the other. Because when you are creating visuals, you have to manage space in order to remain user friendly….
HM DASHBOARD
The dashboard is aiming at getting an overview of all players in the league. You will find the basic information there:
His team, Position, License, HM Points, HM current value, games played, goals assists, Points, PIM (penalties).
And then we added a little extras we thought might help you.
Projected Points: By know you are aware that we have a Points projection model. AND this projection will evolve with the season. Meaning if a player has scored 20 points after 20 games, his Points projection will be 20 + our projection for the remaining 32 games.
Projected PIM: yeah we did the same for penalties. Using the same model than for points, we went back the past three seasons, using a ponderation between seasons and a league adjustment to mostly reflect the changing time on ice between, for example, playing top minutes in U20 or playing on a 4th line in NL… That projection will also evolve with the season.
Points per value: Both Jan Kovar and Roman Cervenka are projected at 58 points by our model. BUT Kovar costs 13.5 and Cervenka 12.5. Looking at his Points/value (basically how many points you will get per million spent), Cervenka will provide 4.6 points per million and Kovar 4.3. That doesn’t mean you have to chooser Cervenka over Kovar but it is certainly helpful to put that into perspective.
We will have the estimated next HM value of the player.
On this page we also show how many games the player’s team will play in the current trade window, and how many in this one + the next.
And as it is an online tool, you can filter the whole league by position and/or Teams and/or license and/or a range of HM Value. You want to see the list of 1/ Swiss 2/ defencemen 3/ Playing for either Zug, Zurich, Lausanne, Geneva or Davos 4/ that cost between 5 and 6.5 ? No problem.
Once you get the list, you can re-order with any of the column, like the games to play in the next trade window.

HM Player Card
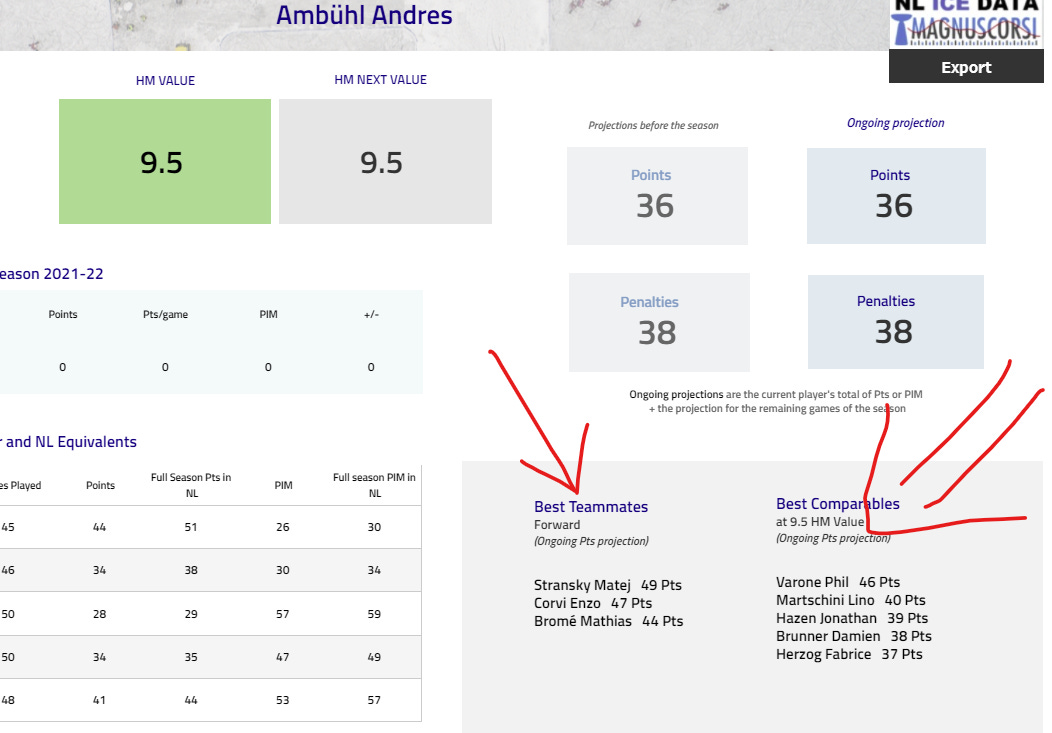
Our second visual is a Player Card, showing additional information on the player but also a couple of tools that would help you build your roster.

So here you have his stats for the ongoing season, but also for the past seasons in terms of Points and PIM to put that into perspective. Both Points and PIM are translated into NL equivalents if the player was not in the league. And projected over a full 52 games seasons to compare all players properly.
You have his HM value and the estimation for his Next value.
You have his Projection for Points and PIM, the one he had at the start of the season (so you can tell us how wrong we were), and his ongoing projection (we explained that earlier for the dashboard).
But the cool stuff (for us at least), is the list of his best teammates at his position. Because we know HM players love to pair players from the same team to get bonus points.

Andres Ambühl best teammates, according to our projections are Stransky, Corvi and Bromé. Of course that list will update itself during the season.
The other cool stuff is that, if you spent 9.5 on Ambühl, who is projected at 36 points, now you know that for that same price, Phil Varone is projected at 46 points, Lino Martschini at 40 points, Jonathan Hazen 39, etc. And of course that list will update itself during the season.
We hope this will help you have fun and help your team. If you had any suggestions for additional tools, feel free to write us on twitter or at nlicedatainfo @ gmail . com.
We’ll see shat we can do !
FRANÇAIS
Nous avons construit deux pages pour l’instant, avec un usage différent pour chacune d’entres-elles. Certaines informations seront sur une page, et le reste sur l’autre car dans la création de visuels, il faut respecter l’utilisation de l’espace pour que cela reste agréable pour l’utilisateur.
HM TABLEAU DE BORD
Le Tableau de bord sert à donner une vue d’ensemble de la ligue. Vous y trouverez les informations de base:
L’équipe du joueur, sa position, sa licence, ses points HM, sa valeur actuelle, le nombre de matchs joués, buts, assists, points, PIM (pénalités).
Puis, nous avons ajouté quelques extras qui, nous pensons, pourraient vous aider.
Projected Points : Vous savez maintenant que nous avons un modèle de projection de points. ET cette projection évoluera au cours de la saison. Si un joueur a marqué 20 points après 20 matchs, sa projection sera de 20 + notre projection pour les 32 matchs restants.
Projected PIM : Oui, nous avons fait la même chose pour les minutes de pénalités. Utilisant le même modèle que pour les points, nous avons pris les trois dernières saisons, utilisant une pondération entre les saisons et un ajustement entre les ligues. Essentiellement pour refléter le temps de glace qui change entre, par exemple, un jeune jouant 25 minutes par match en U20 et se retrouve sur une 4ème ligne en NL. Et la projection évoluera aussi au cours de la saison.
Points par valeur : Jan Kovar et Roman Cervenka sont projetés à 58 points par notre modèle. MAIS Kovar coûte 13.5 et Cervenka 12.5. Si on regarde à leur Points/valeur (en gros combien de points vous rapporte chaque million dépensé), Cervenka vous donnera 4.6 points par million, et Kovar 4.3. Cela ne veut pas dire que vous devez prendre Cenvenka au lieu de Kovar mais c’est certainement utile pour faire certains choix en utilisant cette perspective.
Nous aurons une estimation de la prochaine valeur HM du joueur.
Sur cette page, vous trouverez aussi combien de matchs l’équipe du joueur va disputer au cours de la période de transferts actuelle, et combien pour la période actuelle + la suivante.
Et comme c’est un outil en ligne, il est interactif. Vous pouvez filtrer toute la ligue par position et/ou licence et/ou équipe et/ou valeur HM. Vous voulez connaitre les 1/ défenseurs 2/ Suisse 3/ jouant pour Zug, Zürich, Lausanne, Genève ou Davos 4/ coûtant entre 5 et 6.5 ? Pas de problème.
Une fois que la liste s’actualise, vous pouvez l’ordonner avec n’importe quelle colonne, comme le nombre de matchs à jouer dans la prochaine période de transfert par exemple.

HM Player Card
Notre second visuel est une carte Joueur. Elle donne des informations additionnelles mais surtout quelques outils pour vous aider à faire les bons choix pour votre équipe.

Vous trouverez ici les stats du joueur pour la saison en cours, mais aussi celles des saisons passées pour les Points et les PIM afin de mettre tout ça en perspective. Les Points et les PIM sont traduits en équivalent NL si le joueur n’évoluait pas dans notre championnat. Et projetés sur une saison complète de 52 matchs afin de pouvoir comparer tous les joueurs équitablement.
Vous avez sa valeur HM, et l’estimation pour sa prochaine valeur.
Vous avez ses projections de Points et PIM, celles qu’il avait au début de saison (afin que vous puissiez nous faire remarquer à quel point on avait tort) et les projections actuelles, telles que l’on a expliqué plus tôt pour le tableau de bord.
Mais le truc cool (selon nous en tout cas), c’est la liste de ses coéquipiers les mieux projetés à sa position. Parce que nous savons à quel point les joueurs HM aiment former des blocs de joueurs d’une même équipe afin d’avoir des points bonus.
Les meilleurs coéquipiers de Andres Ambühl, selon notre modèle, sont ainsi Stransky, Corvi and Bromé. Et bien entendu, cette liste se mettra à jour durant la saison.
L’autre outil, c’est que si vous avez dépensé 9.5 pour Ambühl, qui est projeté à 38 points, maintenant vous savez que pour ce même prix, Phil Varone est projeté à 46 points, Lino Martschini à 40 points, Jonathan Hazen à 39, etc. Et oui, cette liste se mettra à jour durant la saison.
En espérant que cela vous amuse et vous aide. Et n’hésitez pas à nous envoyer vos suggestions d’ajouts sur nos twitter ou à nlicedatainfo @ gmail . com.
Nous verrons ce qu’il est possible de faire !
You can also follow us on our Twitter pages here and here or subscribe to our newsletter below if you don’t want to miss our coming articles.
You can also find some more statistics on NL Ice Data here: nlicedata.com

When will the tool be available?